
That Google Ads waste figure: 12 checks for what it counts and how much is real
You've been handed a dollar figure for what your account is wasting or missing. Eleven of these checks run on reports you already have, the twelfth is a live test, and they end in a firm part, an unproven part and a reply you can send, whether the number holds up or not.


Last verified October 2026
A recent r/googleads thread has both endings in it. One commenter's flagged $800 a month turned out to be brand traffic. The poster had heard of a $1,300 flag on a campaign that looked fine, and that one was real: targeting had drifted. The figure itself won't tell you which kind you're holding, and someone is usually waiting for an answer.
An item is here if it changes the size of a waste or lost-opportunity figure, or what you should do about it, and you can run it from reports you already have. Check 12, a live test, is the one exception. The list covers figures from tools, audits, scripts and Google's Recommendations tab. It leaves out invalid clicks (a separate question), comparisons between tools, and other ad platforms. Whether one row deserves a negative is a different decision. Every check runs the same on Search, Shopping and Performance Max, and on value-based accounts, unless it says otherwise.
Expect to end with two numbers, a firm part and an unproven part. Vendors, Cascader included, publish figures like these, and the same checks apply to ours. Google publishes no method for its dollar estimates that we know of, so checks 10 to 12 test what comes out, not how it's made.
- "$X wasted": checks 1 to 7, then 8 and 9 for what comes back and where it goes
- "$X a month" or "you'd save $X": checks 8 and 9, on the rows check 6 gives you
- "Missed conversions" or "raise your budget": checks 10 to 12
- Twenty minutes before a meeting: pull the export below, compare conversions with your books (check 1), filter out your brand (check 5), then sort the flagged rows by cost and read down for whatever time is left (check 6). What you'd refuse is your firm number, and the rest of the figure stays unproven. On a large account, the rest will be most of it. Send those two numbers as they stand, and say you haven't yet checked whether they repeat or where the money would go (checks 8 and 9). For a lost-opportunity figure, do the sum in check 10, send the shorter reply at the end down to its Unproven line, and say the rest waits on a test (check 12).
What a waste figure counts
Everything below starts from one sheet. PPCleaner's guide has the right unit, "one row per search term," because a term split across three ad groups looks like three small problems.
Search terms report,
  same dates as the figure
  Performance Max: the "Search
  terms and landing pages for
  Performance Max" view
Pivot by search term, summing
  clicks, cost, conversions,
  conv. value
Paste as values on a sheet
  called Terms, headers in row 1

A: term
B: clicks
C: cost
D: conversions
E: value
# one row per term, and column C
  adds up to the raw export
Keep the raw export too. Checks 5, 8 and 9 need its campaign column. Keep the figure's own list of flagged rows beside Terms as well: Terms holds every search term, a tool may flag only some of them, such as rows above a spend threshold, and the ledger at the end counts flagged dollars, plus anything check 7 adds.
1. "No conversions" according to what? Match the count to your books first
Every check below leans on this column, so test it before you use it.
Google Ads: Conversions
  (by conv. time),
  last full month
Your records: orders or
  qualified leads, same dates
# within a few percent: carry on
# Ads well above your records:
  something counts twice,
  or counts too easily
# Ads well below your records:
  real sales never reach the row
"A few percent" is one r/googleads thread's reckoning, and its usual suspects for a gap above that are a GA4 import and a native tag both set as Primary, or a page view set as Primary alongside the sale. Fixing the setting won't repair the sheet, because counting changes apply only going forward. So segment the search terms report by conversion action, keep only the real outcome, and rebuild column D from that. Value-based accounts do the same with column E, against booked revenue.
Well below means the sale happens somewhere the row can't see. Google says store visits and store sales aren't compatible with the search terms report, and that thread adds offline uploads landing on the wrong conversion action. Until the missing outcome reaches the row, every zero is suspect and the whole figure stays unproven.
Two smaller leaks. Add All conv. beside Conversions, filter to Conversions = 0, and total the cost of rows where All conv. is above zero: those rows did something, and if it matters to you, they leave the figure. Then see how much spend sits on partial credit, since data-driven attribution is the default for most conversion actions and gives each keyword "part of the credit":
=SUMIFS(C:C,D:D,">0",D:D,"<1")
# spend on rows showing
  a fraction of a conversion
# a rule that says "= 0" skips
  these rows, and one that says
  "under 1" counts them
If that's large, ask which way your figure treats them. One more thing a matching count can't show: a recorded lead can be for something you don't sell. That's a bad row wearing a good number, so read a sample.
2. "Total waste" can count one dollar twice, so keep one cut of the spend
Ask for the lines behind the total. Keep the search-term line, drop every line that cuts the same spend another way, and add up the rows behind what's left. If they match, that's your base figure. If they don't, ask what the difference is before going further. If no rows exist, the whole figure stays unproven; one manager in the thread that opens this page has the right rule: "If the tool cannot show me the terms, I ignore the number."
If columns extend beyond the page, scroll sideways. With a keyboard, focus the table and use the arrow keys.
| Line | Amount | Keep or drop |
|---|---|---|
| Search terms line | $2,900 | keep |
| Device line | $1,400 | drop: same clicks, cut by device |
| Audience line | $800 | drop: same clicks, cut by audience |
| Total as shown | $5,100 | |
| Base figure | $2,900 |
The true total sits between the largest line and the sum.
Keep the search-term line because it's the one with rows you can act on. Keep a campaign line only for campaigns that have no search terms, such as Display and Video.
Totals need this when they're built from slices of the same spend. AuditRoger says so in its published rules, which is the useful kind of candor: its five amounts overlap, so it caps the total at 80% of spend and shows the removed overlap as its own line. PPC.io's free script adds search-term, device, demographic and audience waste into one total, and one click can sit in all four. Word-level reports do it by design, which is how $1,800 of spend shows up as $3,600.
Then set Terms beside campaign cost for the same dates. The gap is spend no report ties to a term: Google leaves out low-activity searches, and in Performance Max the gap also holds whatever ran off Search. Doctor Ads, a consultancy that publishes its account data, found visible terms covered about 67% of search spend in its panel. So when a figure says "30% of your spend," ask which spend, and don't gross it up: the hidden searches aren't a fair sample of the visible ones.
3. "Half of this, 30% of that" is a policy, not a measurement
Find every fixed percentage in the definition and cross out the lines that exist only because of one. Those dollars sit on no row. If little goes, the figure holds. If a lot goes, what's left is the measured part and the rest was a rule of thumb. If the tool publishes no definition, ask for it. Without one, whatever you can't rebuild from rows stays unproven.
AuditRoger's calculator counts half the spend on keywords with a Quality Score of 5 or less, plus 30% of mobile spend when under 1% of mobile clicks convert, then estimates that 70% of the total can be recovered. Publishing those rules is what lets you argue with them, and they're reasonable places to look. They aren't observations about your account. A keyword scoring 4 that sells well still adds half its spend, and Google itself says Quality Score "is not an input in the ad auction."
The recovery percentage deserves the most attention, because it turns history into a promise. Replace it with your own repeat rate from check 8.
4. "Last 30 days" can include conversions that haven't arrived
Find your lag. Once that many days have passed since the figure's dates ended, pull those same dates again, using the plain Conversions column rather than Conversions (by conv. time), and look up the flagged rows. If you can rerun the tool, rerun it on the same dates; if all you hold is a PDF, your own pull does the job, and a PDF with no rows is already unproven under check 2. If the rows barely moved, the window wasn't the problem. Spend on rows that now show a conversion leaves the figure. That difference shows conversions that arrived late on the same traffic, and nothing about the rows still at zero. If the lag hasn't passed yet, nothing leaves and those rows stay unproven. Don't use a different window instead: it changes the traffic too, so the difference isn't lag.
Spend lands today and conversions land later, reported against the query date. For the lag, set a date range that ended at least 30 days ago, or longer if your conversion window is longer, and segment by Conversions > Days to conversion. Note the day by which about 90% have arrived, which is our working cut-off, not Google's, and add any offline import delay.
Short-lag ecommerce may hardly move. B2B can: one practitioner reports a day's revenue reading about 30% differently at 2 days and at 32.
5. "It flagged our brand campaign": find all of it, then set it aside
Filter Terms for your brand names, not just your brand campaign, which catches brand searches sitting inside generic and Performance Max campaigns. Then list any campaign you bought for reach. If neither holds much of the figure, there's nothing to set aside. If they do, delete those rows from Terms and give them their own line. They aren't waste, and they aren't cleared.
The $800 at the top was this. For brand, no report settles whether those clicks would have come anyway, and the pause studies don't yield one rule for every business, so the dollars stay set aside.
For upper-funnel campaigns, open Goals > Attribution > Assisted conversions. A campaign with assists stays set aside: it's on converting paths, though that shows presence, not cause. One with no assists and no conversions goes back on Terms as plausible.
6. "$X on terms with no conversions": a healthy account produces this too
Start by reading. Sort the flagged rows by cost and go down as far as you have time for. With a few hundred zero-conversion terms, that can cover half their dollars. On a big account it can't: in Doctor Ads' accounts, the costliest tenth of zero-conversion terms held a median 48.8% of that spend, and 35.7% in newer data, but that tenth ran to more than 13,000 terms, "far too large to work through by hand," and in the newer data the 100 costliest rows held a median of just 2.2%. Move searches you'd refuse at any price to a sheet called Firm. They're waste with no statistics needed, and Firm only covers what you read. Everything else stays on Terms as plausible, converting rows and unread rows included.
Sorting rows into refused and plausible is the part a person has to own, and it's where a stated reason helps. If the figure came from Cascader, our own tool, each recommended negative comes with a short written explanation and a score. That's for you to judge, and it isn't a forecast of savings.
Now ask what the plausible rows prove. One click at a 3% conversion rate shows zero 97% of the time, so any account with thin rows has money on zero-conversion terms even if every term is fine. The useful question is how much it would show with no bad terms at all. PPCleaner's guide and our $600 post do this arithmetic for one row. Run across a sheet, it gives you a baseline for the total.
Here is a made-up account with 4,000 clicks at $2.50, a 3% conversion rate and, by construction, no bad terms:
If columns extend beyond the page, scroll sideways. With a keyboard, focus the table and use the arrow keys.
| Clicks per term | Terms | Cost | Chance of zero | Expected zero-conversion spend |
|---|---|---|---|---|
| 1 | 1,000 | $2,500 | 97.0% | $2,425 |
| 2 | 300 | $1,500 | 94.1% | $1,411 |
| 5 | 100 | $1,250 | 85.9% | $1,073 |
| 20 | 30 | $1,500 | 54.4% | $816 |
| 100 | 13 | $3,250 | 4.8% | $155 |
| Total | 1,443 | $10,000 | $5,880 (59%) |
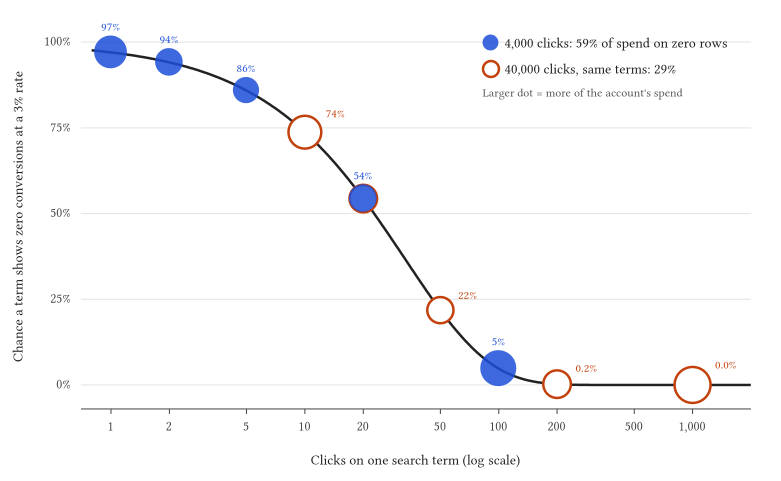
Every group of terms sits on the same curve. Multiply a dot's height by that group's spend in the table and add them up: $5,880 of $10,000. Give the same 1,443 terms ten times the clicks and each group slides right, and the share falls to 29%, though no term changed. Made-up account.
That slide may be part of why Doctor Ads' median advertiser put 39.4% of tracked cost on such terms while the spend-weighted figure is 22.3%. Its dataset says larger budgets show a lower share, "whatever the cause." Thicker rows are one candidate, and we haven't tested that on their data.
A zero-conversion total can't tell you how much was wasted. Set it beside what an account with no bad terms would show, and you see how much of it could be chance.
So the next step is the same however that comparison would come out: read further down the flagged rows if you have time, and move what you'd refuse to Firm. The flagged rows you don't refuse are your unproven rows, and check 8 gives you the rate to put on them.
The sheet below is optional. It runs the argument on your own numbers, and nothing from it enters the ledger. Build it on what's left on Terms: add one helper column with a header, fill it down to the last row, then add the cells:
F2  =C2*(1-$K$1)^B2
    # what this row would show
    at one rate
K1  =SUM(D:D)/SUM(B:B)
    # that rate
K2  =SUMIF(D:D,0,C:C)
    # actual spend on zero rows
K3  =SUM(F:F)
    # the baseline
# in the made-up account:
  K3 is $5,880
Set K2 beside K3. K3 assumes every row converts at one rate, your sheet's average. Under data-driven attribution, one conversion can land as fractions on several rows, so fewer rows show zero and K2 falls with no change in the terms, which makes the comparison rough. Either way, a gap proves neither bad terms nor waste, and no gap clears anything.
7. "That term converted, so it's fine": the figure can be too low
A zero filter stops counting at the first conversion, so a term with one fluke lead against $400 drops out of the figure. Total what your converting rows spent beyond what those conversions can pay for. Use whichever G2 fits, in the same unit as your conversion value, and fill it down under a header:
G2  =MAX(C2-D2*$K$4,0)
    # lead gen: K4 is the most
    you can pay for a conversion
G2  =MAX(C2-E2/$K$4,0)
    # value-based: K4 is your
    required ROAS, 4 for 400%
K5  =SUMIFS(G:G,D:D,">0")
    # spend the zero filter
    never saw
# that $400 term with one lead,
  at a $100 limit, adds $300
If K5 is small next to the figure, the original stands. If it's large, the figure is low: add K5 to the unproven line, leaving out any row the tool already flagged, as PPC.io's script does with rows past its CPA limit, because those dollars are already in the figure. It stays unproven because one conversion is thin evidence in either direction, so read the top of the list before quoting the total.
What a waste figure predicts
8. "$X a month" assumes the same searches come back
Look your Firm rows up in the equal window before the figure's. It passes if most of their spend shows up there. The rate you get replaces "×12" and "70% recoverable."
A WordStream PDF shows its Grader's "projected 12 month" waste at four times "the last 90 days," and the banner on the Grader page carries the same ratio. That holds if the same searches repeat. Google said in 2017 that 15 percent of searches it sees every day are new, and later that this has held for more than a decade.
Firm:   your rows, one per term,
        with the Terms layout
Before: the equal window before,
        pivoted the same way

F2
=SUMIF(Before!A:A,A2,Before!C:C)
# what this term cost before
G2
=SUMIF(Before!A:A,A2,Before!D:D)
# what it converted before
K1  spend this window, campaigns
    that ran these rows
K2  spend in the window before,
    same campaigns
K3  =SUM(F:F)/SUM(C:C)*K1/K2
    # repeat rate
K4  =SUMIF(G:G,">0",C:C)
    # your rows that converted
    before
# K3 above 100%: these windows
  aren't comparable,
  try another pair
# K1/K2 takes out a budget
  change only if spend moved
  in proportion across
  those campaigns
A high K3 says the money was recurring, and the figure's run rate is fair. A low K3 says most of those exact searches were one-off, and K3 × your Firm total is what's in play next period for those strings.
A low K3 doesn't show the need went away: K3 looks each term up as an exact string, so a new wording of the same thing counts as gone, while a phrase negative on salary "catches every unseen query containing the word." If your refused searches are built around a word, filter both windows for it, compare cost, and use that rate for those rows instead of K3.
Use K3 only on the rows it came from: build a second sheet the same way from your flagged unproven rows, leaving check 7's rows off, and read their own rate there. That rate stands in for check 7's dollars too, so treat that part of the range as rough.
K4 is your false-positive rate in dollars, so read those rows again. Testing cut-offs on held-out queries isn't new; PEMAVOR recommends it before publishing negatives.
Check change history before you trust K3. A negative removed, or a keyword or match type added, between the windows means a term couldn't have run before, so the rate reads low. A negative added since means the term has already stopped, so take it off the sheet. If only some of those campaigns started, paused or changed budget, call K3 rough. Compare like seasons.
9. "You'd save $X" depends on what limits the campaign
Take last month's spend as a share of budget for each campaign, note its bid strategy, and find its row. Then split the firm dollars from check 8 by campaign and add them up by row, because most accounts land in several, and the ledger takes each call as its own amount. Read a shared budget as one campaign. The 90% line is ours, and so are the calls in rows two to five and the Performance Max note below the table: where a row leans on Google's wording it links the page, and the step from there to the call is our reasoning.
If columns extend beyond the page, scroll sideways. With a keyboard, focus the table and use the arrow keys.
| Spend vs budget | Bid strategy | Where a blocked dollar goes | Call it | How you'd see it |
|---|---|---|---|---|
| 90%+, or Limited by budget | Manual CPC, Maximize clicks, Target impression share, Maximize conversions or value | Stays in the budget and buys other clicks | Redeployed | Spend holds, clicks shift |
| 90%+, or Limited by budget | Target CPA or ROAS | Stays in the budget, and the target holds the average | Redeployed | Spend holds, average stays near target until you move it |
| Under 90% | Manual CPC, Target impression share | Nothing pushes it back | Saved | Spend falls by about what you blocked |
| Under 90% | Maximize clicks, Maximize conversions or value | Google describes these as spending the average daily budget, so it may find other auctions | Probably saved | Spend falls, unless it finds them |
| Under 90% | Target CPA or ROAS | Google aims for as many conversions as possible at the target, so cleaner traffic can buy more volume | Not settled | Spend falls and conversions hold: saved. Spend holds and conversions rise: redeployed |
PPCleaner's guide says "negative keywords do not reduce your spend." That's right in the first two rows. In the others the budget isn't what sets spend, and there are plenty of others: in one managed portfolio Doctor Ads measured in June 2026, the median Search campaign spent 28.8% of its budget and the median Performance Max campaign 80.7%, while campaigns at 90% or more carried 45% of the spend.
Row two needs the August change. Since August 17, 2026, target campaigns limited by budget aim at their target instead of beating it. If spend is fixed and the average sits near the target, conversions sit near budget ÷ target, whatever you block. To take the gain as cheaper conversions you'd set a more efficient target, and Google warns daily spend will likely be affected. What a Target Does When the Money Runs Out works through why.
Performance Max takes its row from its strategy, with one difference: negatives reach Search and Shopping inventory only, so a blocked dollar can also move to its other channels. To see which row you're really in, compare equal windows whose conversions have finished arriving.
What a lost-opportunity figure leaves out
10. "Missed conversion value": find the price before you quote it
Work out what the next conversions cost. A price above what a conversion is worth means you're right to be missing them. A price below it earns a test, not a conclusion, because both sides of the division are Google's estimates.
Before:  $3,500 a week,
         50 conversions
         $70.00 each
After:   $5,250 a week,
         62 conversions
         $84.68 each

Next conversions:
  $1,750 ÷ 12 = $145.83 each
# the average rose about $15,
  and the new ones cost more
  than twice the old average
# value-based: extra value ÷
  extra cost, against the ROAS
  you need
That's a made-up week. For yours, open the recommendation. In published captures, Google's Missed opportunities beta shows clicks, conversions and value with no cost column, though your account may differ, and in 2025 "View recommendation" opened the target simulator. Recommendations > Investment Strategy shows estimated weekly impact and average CPA or ROAS. If you can find no cost anywhere, the figure stays unpriced and unproven. With only a budget and a count you can still get a ceiling: one reported example goes from ₹5,000 to ₹8,700 a day for 13.4 more conversions a week, about ₹1,933 each if the whole raise gets spent.
A recommended budget answers a different question. Google defines it as "the estimated lowest budget amount at which you wouldn't lose any impressions due to budget constraints," and nothing in that says it pays. The next dollars can also buy different traffic: at 95% brand impression share, every new dollar goes to non-brand.
11. "Lost impression share is costing you $X": that sum holds every rate still
Find the line that multiplies lost impression share by your current click and conversion rates. If it's there, the figure is a sketch: it passes only if the rates are allowed to fall. If it came from Google's report instead, run the one-minute test below.
The method is old and open about its assumption. PPC Hero's 2015 walkthrough says "CTR, CPCs, Conv. Rates and AOV should remain relatively consistent." They don't have to. Here are two campaigns from a published capture of Google's report, with the rates worked out:
If columns extend beyond the page, scroll sideways. With a keyboard, focus the table and use the arrow keys.
| Row | Campaign 1 | Campaign 2 |
|---|---|---|
| Actual clicks | 34,431 | 18,123 |
| Actual conv. | 1,939.77 | 1,083.39 |
| Actual rate | 5.63% | 5.98% |
| Potential clicks | 8,933 | 41,544 |
| Potential conv. | 412.37 | 142.87 |
| Potential rate | 4.62% | 0.34% |
| Straight line says | 503 | 2,484 |
Campaign 2's straight line runs 17 times Google's own estimate. That doesn't make Google's model right, but it isn't holding rates constant, and it hands you the test: divide potential conversions by potential clicks. If the answer equals your current rate, someone drew a straight line. If it's lower, the estimate has at least priced in worse traffic, and check 10 is next.
Two cautions if you're computing it yourself. Search lost IS (budget) is a percentage of time and eligible impressions are an estimate, so, as the Denver agency BLKDG notes in its audit guide, multiplying them gives a number Google doesn't define. And since August 17, 2026, budget-limited target campaigns bid toward their target, which moved lost share from rank toward budget in vendor data, so don't compare across that date. We wouldn't lean on the metric for Performance Max or untargeted Maximize strategies, where it isn't established as a diagnostic.
12. "Raise your budget for 12 more conversions": a forecast isn't a test
Google's forecasts are "estimates based on historical data," typically a 7-day forecast in Investment Strategy. Its Results tab reports what applied recommendations did against "an estimate of what would have happened." It's worth reading, and the baseline is still Google's. So this is the one check that spends money: change one thing on one campaign, and judge only what changed against something you left alone.
Is the test worth running? Run the sums on the lift you expect before you commit budget. Break-even is extra spend ÷ what a conversion is worth: six weeks of check 10's raise is $10,500, and at $180 a conversion that's 58 extra conversions. A result is firm only if Extra minus Noise, both in the block below, beats break-even, and on those numbers that's 72 minus 71. So plan on unproven: the test buys a bet, not an answer. Firm takes a wider gap between price and worth or a much longer test: at a true $145.83, expected counts reach firm after about 164 weeks if a conversion is worth $180 and 23 if it's worth $300, and even then only about half the time. If that bet isn't worth $10,500 to you, don't run it, and leave the figure unproven.
A budget raise only does anything on a campaign limited by budget. Anywhere else you're raising a ceiling nobody is reaching. A target change on a Search campaign can run as a custom experiment, which splits traffic and budget inside the campaign; these aren't available for Shopping. For everything else, use a similar campaign you won't touch. With none, before-and-after is all you have and the season is still in the number, so call the result unproven. Compare the two campaigns' search terms first. If the raised campaign can take queries from the other, the baseline falls and Extra rises, so pick one that doesn't share its searches:
Baseline = conversions before
  × (other campaign after
     ÷ other campaign before)
Extra = conversions after
  − baseline
Noise = 2 × √ of this whole sum:
  after
  + baseline² × (1 ÷ before
    + 1 ÷ other before
    + 1 ÷ other after)
Readable when Extra beats Noise
At 50 a week, with a lift of 12 and the other campaign the same size and flat:
If columns extend beyond the page, scroll sideways. With a keyboard, focus the table and use the arrow keys.
| Length | Before → after | Extra | Noise | Reading |
|---|---|---|---|---|
| Two weeks | 100 → 124 | 24 | 41 | can't read it yet |
| Four weeks | 200 → 248 | 48 | 58 | can't read it yet |
| Six weeks | 300 → 372 | 72 | 71 | you can, just |
With the other campaign half the size, eight weeks still falls short, 96 against 100.
That ladder assumes check 10's full raise, a 50% step, with the whole lift of 12 showing up, and a comparison the same size. The working habit among practitioners, not Google, is steps of 20 to 30%, one lever at a time, judged on the increment, with a budget cap, a success metric and a kill date, signed off by whoever approves spend. A smaller step risks less and lifts less, so it takes longer to read. Settle the step and the length together before you spend.
Plan on $1,750 × 6 = $10,500 here and get that approved as a planned figure, not a cap: an average daily budget can spend up to twice its amount on a given day and evens out only over the month, and a cut in mid-month doesn't take back what's been spent, so the real spend can land either side. The budget goes back at week six, and late conversions arrive whether it stays up or not. So read at week six plus your lag from check 4: pull the six test weeks in the plain Conversions column, with at least the 30 conversions Google recommends for judging results, or 50 for Target ROAS, and use the extra spend the test really shows in break-even.
Readable says a lift exists, not that it pays, and the read price, extra spend ÷ Extra, can't tell you. To clear the line, Extra has to beat Noise, which holds the read price near or below extra spend ÷ Noise, about $147 on the six-week line, whatever the raise really costs.
So judge the result in conversions. Firm means Extra minus Noise beats break-even: the raise comes back, and Extra minus Noise, not Extra, goes on the firm line. Anything else is unproven, which doesn't mean the raise lost money. It stays off unless the plan you signed before the test says what read would keep it. That bar is your call, and the further Extra sits above break-even, the stronger the case.
A value-based account won't get a firm result from these sums, because Noise works on conversion counts and a count can't see what the extra orders were worth. Run the same baseline sum on value, compare extra value ÷ extra spend with the ROAS you need, and treat the answer as unproven.
The number to send back
The person waiting doesn't need the method. Send the ledger. With made-up numbers, for a waste figure:
If columns extend beyond the page, scroll sideways. With a keyboard, focus the table and use the arrow keys.
| Line | Amount |
|---|---|
| Figure as shown | $6,000 a month |
| Counted twice (check 2) | −$1,100 |
| Percentages with no rows behind them (check 3) | −$400 |
| Flagged rows that did convert (checks 1, 4) | −$500 |
| Set aside: brand, upper funnel (check 5) | −$800, not waste, not cleared |
| Left to judge | $3,200 |
| Firm: searches we'd refuse at any price (6) | $1,400 |
| Unproven: flagged rows not refused (6) | $1,800 |
| Unproven: missed by the zero filter (7) | +$500 |
| Firm × 45% repeat rate (8) | $630 a month |
| Unproven × 30% repeat rate (8) | $690 a month |
| Range | $630 to $1,320 a month |
| Of the firm $630 (9) | $150 saved, $80 probably saved, $300 redeployed, $100 not settled |
The low end is the firm line. The high end adds the unproven line. A check that changed nothing just keeps its line at zero, which is worth reporting too.
For a lost-opportunity figure, the reply is shorter, because nothing is firm until something has been measured:
If columns extend beyond the page, scroll sideways. With a keyboard, focus the table and use the arrow keys.
| Line | Reply |
|---|---|
| Google's estimate | +12 conversions a week for +$1,750 |
| Price of those conversions (10) | $145.83 each |
| What one is worth to us | $180 |
| Firm | $0: nothing measured yet |
| Unproven | up to 12 a week, $2,160 of value for $1,750 |
| Next (12) | the full raise on one campaign for six weeks, about $10,500 planned, then back to the old budget until the read; likely result, unproven |
How far to take this depends on what being wrong would cost. A search for something you don't sell needs no figure at all: run the reach test and add the negative. A large budget raise needs everything from check 10 on. For the cases between, stop checking when the low end and the high end of your range lead to the same decision. If $630 a month and $1,320 a month would both justify the same afternoon of cleanup, do the cleanup. If they wouldn't, the number still has work to do.