
What a brand-ad pause actually measures
Reconstruct paid and organic traffic in the same experiment, keep rivals’ opportunity in view, and distinguish click replacement from the business outcomes brand-pause studies actually measured.

One reason to question a brand-ad budget is that people may reach the same site through its organic result. One reason to defend it is that a rival may take the top paid position. Both mechanisms have evidence behind them. They do not give us a single percentage of brand spend worth keeping.
Start with two historical results. In Edmunds’ randomized 2015 brand-ad pause, organic gains offset about 43% of the measured paid-session decline. Total measured search-origin sessions still fell. In eBay’s 2012 Yahoo/MSN pause, an adjusted model implied about 99.5% retention of total referred clicks. That second percentage has a different denominator. Reconstructing it explains more than putting the two numbers side by side.
Paid down, organic up, total still down
Edmunds assigned 105 of 210 US geographic markets to suspend 6,587 keywords containing its name on Bing and Yahoo; the other 105 kept advertising. Competitors remained eligible to advertise. The pause ran from October 14 to November 5, 2015.
Coviello, Gneezy and Goette’s Table 2 puts each market’s estimated changes on the same baseline: its average daily total measured search-origin sessions before the experiment. Expressed per 100 of those baseline sessions, the unadjusted estimates are 9.8 fewer branded paid sessions, 4.2 more organic sessions, and 5.6 fewer total sessions, relative to markets assigned to retain the ads.
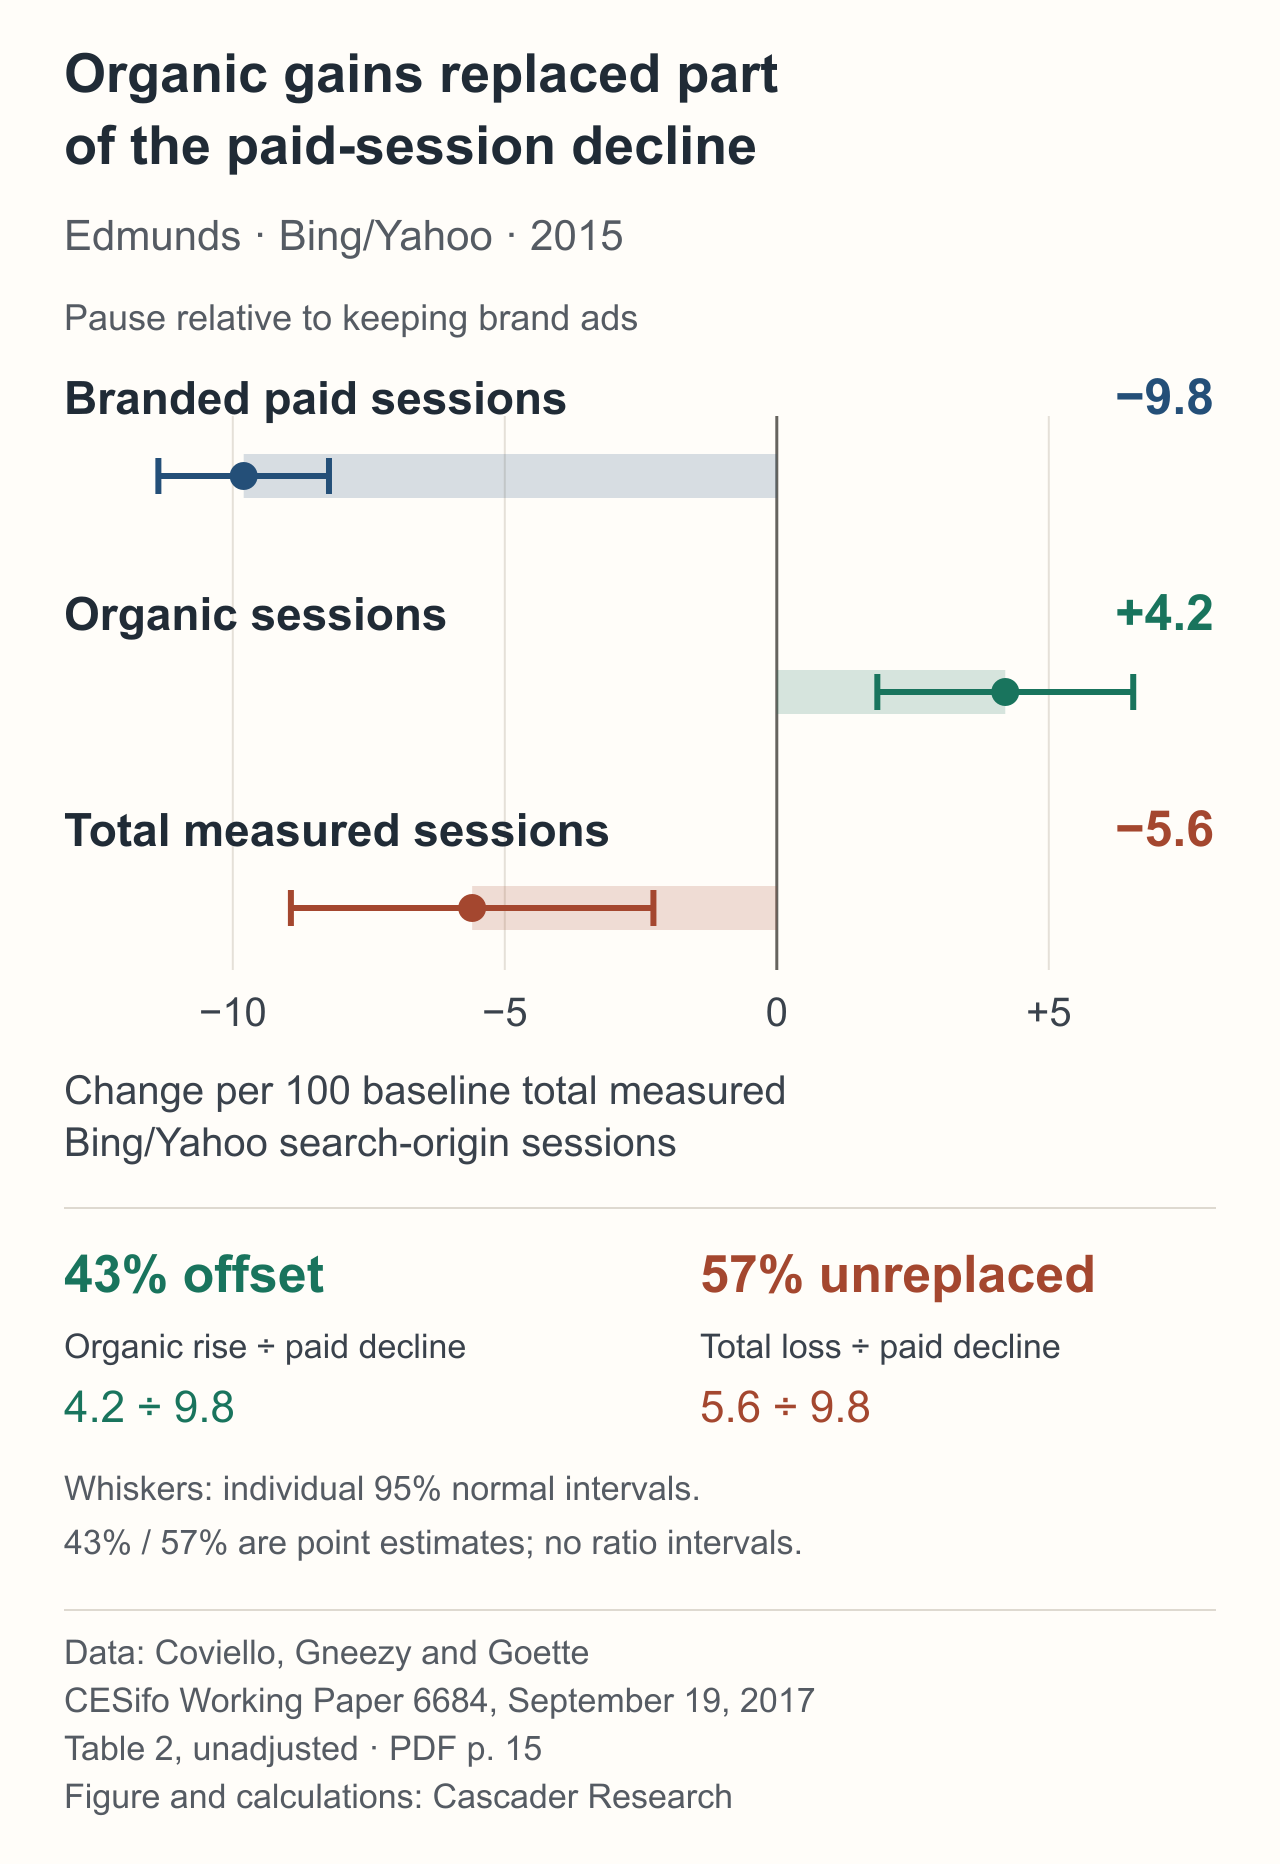


The organic rise was substitution in the aggregate accounting, but it was smaller than the paid decline. The remaining total loss was 5.6 per 100 baseline measured sessions; its approximate individual 95% normal interval is a loss of 2.3 to 8.9. The 43% offset and 57% unreplaced fractions are point estimates, without ratio confidence intervals.
Here “100” is a unit of scale, not a tracked group of 100 people. The study did not observe where the missing sessions went. They cannot be assigned to rivals, direct visits or lost purchases.
Nor was this complete elimination of paid traffic. Other Edmunds campaigns continued to produce some branded paid sessions. The experiment estimates the effect of assignment to suspend the specified terms, with that residual traffic present. Its organic-session measure also does not establish that every organic query contained the brand.
Accounting for baseline paid share changes the estimates to −10.2 paid, +4.0 organic and −6.2 total per 100 baseline sessions: about 39% offset. Partial replacement remains the finding under that specification. Larger estimated total losses in markets with higher baseline paid share describe heterogeneity; paid share itself was not randomly assigned. Design, uncertainty and calculation.
Why eBay’s 99.5% answers a different question
In March 2012, eBay stopped brand-containing paid terms on Yahoo/MSN, using Google brand traffic as a seasonal comparison. This was a platform pause, rather than the Edmunds geographic randomization.
The adjusted MSN coefficient for total paid-plus-organic referred clicks was −0.00529 in logs. Exponentiating it gives 0.9947, or about 99.5% total-click retention. Its approximate 95% normal interval for the percentage change runs from −3.9% to +3.0%. The point estimate is close to full retention; the uncertainty permits a loss as well as a gain.
A footnote supplies the other denominator: the roughly 0.5% total-click loss was roughly 1.5% of paid clicks. On those rounded quantities, about 98.5% of the paid-click decline was offset in aggregate. A small loss relative to all search clicks can be a larger loss relative to the paid component.
So, for an organic-substitution argument, take the paid denominator to the meeting: about 43% offset in the unadjusted Edmunds specification versus about 98.5% implied by eBay’s rounded footnote. Keep the design, site, period and measured unit attached. The differences establish variation; they do not identify which difference between the businesses caused it. eBay’s Table A1 and denominator note.
A pause also changes the rival’s opportunity
Removing an owner’s ad while rivals can remain above the organic result creates a different search page from removing all top ads. That distinction changes what a click estimate can tell us about brand defense.
In Simonov, Nosko and Rao’s 2014 Bing experiment, users were assigned different caps on the number of top paid ads. Cap zero removed all top ads. The 824 brands that usually advertised on their own names also had the owner in the first organic position. Moving from cap zero to cap one added 2.27 owner clicks per 100 searches, while the owner ad received 36.4 paid clicks per 100 searches. The extra owner clicks were about 6.2% of that paid volume.
This is strong evidence of organic crowd-out in that contrast: much of the ad’s traffic would otherwise have reached the owner. But its ads-off condition also removed competing top ads. It does not directly measure an owner switching off while leaving rivals above it.
A different set of 181 brands, which did not bid on themselves, shows the rival opportunity: with a competitor in the top paid slot, competitors received about 17–18 clicks per 100 searches across the study’s organic-click-rate groups. The 824 self-bidders and 181 non-self-bidders are different populations. Combining their results into one matched “with our ad / without our ad” comparison would erase that selection. Bing caps and populations.
Simonov and Hill’s 2021 final publisher abstract gets closer to the question of removing the owner’s top paid link. Competitors collectively received 6–15% of brand-query traffic when that link was removed, versus 1–2% when present. Among rival clicks, 20–47% returned to Bing in under 30 seconds, versus 7% after owner-link clicks. These ranges describe conditions, not confidence intervals.
A quick-back is an imperfect success proxy; staying away for 30 seconds is not a recorded purchase. These results come from the final publisher abstract; full-text methods were unavailable. The earlier preprint remains a separate edition. Final abstract and edition boundary.
There is also a useful counterexample to the claim that a better rival position guarantees a gain. Golden and Horton studied two competing service marketplaces in March 2014. One randomized all Google search ads off in half of 210 US markets. The other’s ad on the first firm’s brand query moved up about 0.931 positions, approximately second to first. Yet the study detected no positive gain in that rival’s brand-ad clicks or overall registrations.
The rival-click estimate was negative, with an approximate 95% normal interval spanning −34.1% to +5.0%. Its registration estimate was about +0.9%, with an interval of −5.2% to +7.4%. Those results constrain the observed gain; they do not prove exact zero or exclude later, unmeasured transfer. Twenty-one days were usable after exclusions. Marketplace intervention and endpoints.
The separate question: did business value change?
A lost owner session and a rival click are traffic outcomes. Even a measured registration stops short of profit or lifetime customer value.
There is, however, a brand-only business endpoint in the eBay paper. In January 2013, eBay suspended Google ads for the keyword “eBay” in eight randomly assigned German states and retained them in the other eight. The outcome was the total dollar value of goods purchased by eBay users—gross transaction value, not booked fee revenue or profit. This is a separate experiment from the 2012 MSN click pause.
Table A3 reports the effect of ads being on under three time-control specifications. Each point estimate is near zero, and each is too uncertain to distinguish from zero. The negative signs mean slightly lower estimated transaction value with ads on; reading them as sales losses caused by pausing would reverse the contrast.
| Time controls | Estimate | Approx. 95% interval |
|---|---|---|
| All available days | −0.14% | −2.16% to +1.91% |
| January 1 onward | −0.42% | −2.96% to +2.19% |
| January 1 onward, with state trends | −0.09% | −2.80% to +2.69% |
Percentage effects and intervals are Cascader calculations from the log coefficients and state-clustered standard errors in Table A3. The intervals use a normal approximation; a short window and only 16 states limit precision. Coefficients and calculation.
This is evidence against a clearly detected transaction-value benefit in that historical eBay test. It is also compatible with modest effects in either direction. It supplies neither a universal zero-sales result nor a precise return on the German ad spend, which is not disclosed.
Golden and Horton measured another business endpoint: the owner’s overall new registrations fell by about one fifth when its search ads were off. But that treatment stopped brand and nonbrand ads together. The owner-registration loss cannot be assigned to brand ads alone. The German eBay experiment is closer to a brand-only value claim; the marketplace experiment is closer to an all-search-acquisition claim.
Where Google’s large pause studies fit
These click studies return to the replacement question: was the owner’s organic route available, and where?
Google’s 2011 study reported a paid-click-weighted 89% incremental-ad-click ratio across 446 selected advertiser pauses. The ratio was modeled loss of total paid-plus-organic clicks divided by modeled paid-click loss. These were observed spend pauses, screened for a drop over 95% and model quality; about 55% of candidate pauses passed. They mixed query types and measured clicks.
A different 2012 pause set helps explain why organic availability matters. Its fitted click-incrementality was about 50% with a same-domain organic result in rank one, versus about 99% without one on the first page. Organic rank was not randomized, and ad position varied with it.
Their selected, modeled, mixed-query results are useful context for search advertising. They cannot supply a randomized brand-only customer-value effect. Google studies, samples and model.
Take the comparison that answers the claim
For “the organic result will replace our paid traffic,” the Edmunds arithmetic and eBay footnote let you compare replacement relative to the paid traffic removed. The point estimates differ substantially, and the original conditions travel with them.
For “rivals will take that traffic,” use evidence that preserves rivals’ eligibility when the owner’s top paid link disappears. Simonov and Hill’s final abstract is relevant to that opportunity; the Bing all-top-ads-off comparison answers a different counterfactual. Golden and Horton show why a rival’s improved position still needs its own click and registration measurement.
For “the brand budget creates customer value,” eBay’s German experiment gets as far as brand-only gross transaction value, with noisy estimates near zero. The marketplace registration loss belongs to an all-search-ad pause. Neither a traffic ratio nor quick-back behavior completes the value claim.
What would materially advance the budget question is a matched brand-only owner-off comparison with rivals still eligible, measuring the owner’s business outcome across firms and retaining spend and value information. That is an evidence requirement, not a pause recommendation for an account. The historical originals here do not observe that whole relationship.
Return to the originals
These notes preserve the editions and calculations behind the comparisons above. PDF page numbers count from the first page of the linked file. The source-edition cutoff is September 25, 2026, 03:36:57 UTC; the results describe historical interventions, not current platform performance.
Edmunds: session accounting, residual traffic and uncertainty
Coviello, Gneezy and Goette, A Large-Scale Field Experiment to Evaluate the Effectiveness of Paid Search Advertising, CESifo Working Paper 6684, September 19, 2017. Design: PDF pp.7–9; continuing residual traffic: p.10; Table 2: p.15; Table 3: p.16. Baseline August 9–October 13, 2015; treatment October 14–November 5. The 210-market regressions weight markets by baseline measured sessions. Outcomes are daily Bing/Yahoo organic plus branded paid sessions, rather than all-channel traffic.
Table 2 unadjusted coefficients and robust standard errors are paid −.098 (.008), organic +.042 (.012), total −.056 (.017). Multiply both coefficients and errors by 100 for the figure. Individual normal intervals use estimate ± 1.96 × standard error: paid [−11.368, −8.232], organic [1.848, 6.552], total [−8.932, −2.268] per 100 baseline sessions. The ratios are 4.2/9.8 and 5.6/9.8; their joint uncertainty needs covariance not supplied here. They are not people-level transitions.
The baseline-paid-share-adjusted estimates are −.102 (.003), +.040 (.011), −.062 (.012), yielding 4.0/10.2 ≈39% offset. Other campaigns left paid sessions at roughly 2–3% of baseline total measured sessions; this is not 2–3% of baseline paid traffic. Table 3’s association with baseline paid share is not an experiment on that trait. No public sales result or destination trace is supplied by this experiment.
eBay 2012: total-click retention versus paid-click replacement
Blake, Nosko and Tadelis, Consumer Heterogeneity and Paid Search Effectiveness, saved author original dated August 12, 2014, associated with the 2015 Econometrica publication. The linked author file is the edition used here. Brand-pause narrative and denominator footnote: PDF pp.6–8; Table A1: p.23.
The March 2012 Yahoo/MSN pause used Google brand traffic as a comparison; it was not geographic random assignment. Table A1’s adjusted MSN interaction is −.00529 (SE .0177), with date effects and platform trends. exp(−.00529) = .994724 is modeled total-click retention, not the observed fraction of each paid user returning organically. Cascader’s normal percentage interval is 100 × [exp(−.00529 ± 1.96 × .0177) − 1], or approximately [−3.92%, +2.98%]. The footnote’s rounded 0.5% total loss ≈1.5% paid loss implies approximately 98.5% paid-click replacement.
The unadjusted MSN and uncontrolled July Google pauses are different estimates and are not used to manufacture the adjusted result. Appendix control wording is inconsistent with the narrative about Yahoo; this account does not invent an untreated Yahoo group. Direct visits and rival destinations were not measured.
Bing 2014: ad caps, two populations and two denominators
Simonov, Nosko and Rao, Competition and Crowd-Out for Brand Keywords, Marketing Science 37(2), 200–215, online January 29, 2018. Method and retained brands: PDF pp.4–5; Figure 2 and self-bidder estimates: p.7; Figure 7 and top-rival comparison: p.10. Nine days in January 2014; a small share of US Bing users; 2,517 retained companies with the owner in the first organic position. Caps removed lower top ads first; a cap did not always bind.
For 824 brands self-bidding more than 90% of the time, the 2.27 added owner clicks and 36.4 owner paid clicks are both per 100 searches. Their ratio is 6.24% incremental relative to the paid volume; this is not a percentage of all searches, a ratio confidence interval or a return on spend. Cap zero removes all top ads, not every possible paid location on the page.
The 181 non-self-bidding brands are a separate set. Figure 7 groups them by their organic click rates under cap zero; competitor top-slot traffic is about 17–18 clicks per 100 searches across groups. Rival traffic gain need not equal owner traffic loss. The paper’s plotted error bars are ±2 standard errors. No sales endpoint is measured.
Simonov–Hill: final abstract access and earlier edition
Simonov and Hill, Competitive Advertising on Brand Search: Traffic Stealing and Click Quality, Marketing Science 40(5), 923–945, online August 24, 2021. The public publisher abstract supports the final numbers above and calls the comparison quasiexperimental. It does not supply accessible full-text methods or establish that all owner ads elsewhere were absent.
The April 29, 2019 author preprint, Traffic Stealing and Consumer Selection, gives earlier methods and different estimates. Its values are not substituted for the final abstract, and the two editions are not independent corroborating studies. Quick-back ranges cannot be paired and multiplied into a conversion estimate.
Two marketplaces: better rival position, clicks and registrations
Golden and Horton, The Effects of Search Advertising on Competitors: An Experiment Before a Merger, original dated October 10, 2019. Experimental assignment and exclusions: PDF pp.15–17; Table 2: p.25; Table 3: p.31. The firms are anonymous. A 28-day March 2014 all-Google-search-ad pause yielded 21 usable days after a bidding anomaly and denial-of-service exclusions; the other firm continued bidding with minimal changes.
The rival’s position coefficient on the owner’s brand query is −.931 (.017), meaning improved numerical rank. Rival clicks use a Poisson model: coefficient −.184 (.119), rather than an ordinary regression on log counts. Registrations have coefficients −.229 (.028) for the owner and +.009 (.032) for the rival. Cascader converts coefficients with 100 × [exp(coefficient) − 1] and approximate individual normal intervals with 100 × [exp(coefficient ± 1.96 × SE) − 1].
This yields owner registrations −20.47% [−24.71%, −15.98%], rival registrations +0.90% [−5.23%, +7.44%], and rival brand clicks −16.81% [−34.11%, +5.05%]. The authors describe the owner registration decline as roughly 23% using the coefficient approximation; the one-fifth description above uses exponentiation. A signed-axis imputed traffic figure is not an observed transfer ledger. Registration is not monetized customer value, and the owner’s treatment is not brand-only.
eBay Germany: gross transaction value and the ads-on sign
The same Blake, Nosko and Tadelis author original defines sales in footnote 3, PDF p.4, as total dollar value of goods purchased by users. German experiment methods: p.25; Figure A1 and Table A3: p.26. Eight of 16 states were randomly assigned to suspend the “eBay” brand-keyword ads in January 2013. The other eight retained them. The paper does not measure rival activity in this test.
Table A3’s ads-on interactions for log sales are −.00143 (SE .0104), −.00422 (.0132), and −.000937 (.0140), in that order. All models include state and date effects; the latter two restrict observations to January 1 onward, and the last adds state trends. Sample sizes are 912, 416 and 416. Standard errors are clustered by state.
Cascader’s point estimates of percentage change use 100 × [exp(coefficient) − 1]. Approximate individual 95% normal intervals use 100 × [exp(coefficient ± 1.96 × SE) − 1], giving the displayed rounded values. These are calculated intervals, not exact small-cluster inference. None of the reported coefficients is statistically distinguishable from zero. Negative ads-on coefficients are not pause-caused sales losses. Public German ad spend is unavailable, so this table cannot produce a precise spend-return calculation.
Google: selected pauses, organic availability and fitted incrementality
Chan, Yuan, Koehler and Kumar, Incremental Clicks Impact of Search Advertising, Google, 2011. Method and filters: PDF pp.1–3; aggregate results: p.3; conclusions: p.5. Its 446 accepted October 2010–March 2011 pauses used model predictions for paid and total clicks at high and low spend in the same post-period. Reported paid-click-weighted mean is 89%; unweighted mean 91%; median 95%. The rounded subgroup summaries do not independently reconstruct the 91% mean; the article uses the separately reported weighted result.
Chan, Kumar, Ma and Koehler, Impact of Ranking of Organic Search Results on the Incrementality of Search Ads, March 19, 2012. Definitions and different 390-study April–October 2011 sample: PDF pp.3–5; fitted regression: p.11. “Associated organic” means matching website domain on the first results page, not a brand-query label. The sample’s 81% of ad impressions and 66% of ad clicks without that result use different denominators.
The fitted regression retained 332 pauses after its model restriction. Rank-one coefficient .50130 (SE .02161) gives approximately 50% incremental clicks; no-first-page-organic coefficient .99363 (.01059) gives approximately 99%. These are fitted category coefficients, not advertiser prediction intervals or randomized effects of organic rank. Neither paper measures incremental conversions or indirect navigation.