
Fewer clicks, longer search bouts: what a week of imposed AI Mode measured
Among retained active-search volunteers over seven days, imposed AI Mode versus unchanged Google showed lower external clicking per counted search, fewer bouts and more foreground Google time per bout. A separately selected survey reported worse experience. What those measures let you say.

Fewer clicks can make two very different stories sound plausible: people found what they needed without leaving Google, or the search experience became less useful. A click count cannot choose between them.
A March 2026 experiment gives us more of the pattern. Among the volunteers included in its behavioral analysis, imposed Google AI Mode was associated with fewer outward clicks per counted search, fewer Google search bouts per day, more foreground Google time per bout, and more people using another search engine during the week. A separately selected survey comparison reported lower usefulness, satisfaction and agency. The results challenge an automatic “fewer clicks means greater efficiency” interpretation. They do not identify the missing clicks' destinations or whether tasks succeeded.
The important word is imposed. This was a seven-day comparison among compensated US adult volunteers whose main browser and search engine were Chrome and Google. The intervention routed searches into AI Mode and hid the All and Web tabs. Unchanged Google, the comparator, still allowed AI Overviews and optional AI Mode. The study therefore tests that bundle of interface changes against ordinary Google, including its optional AI—not voluntary adoption or today's product. Study design: Wang and colleagues, §§2–3 and supplement S2.2.
Click counting · Search bouts and experience · Hiding AI · What no-click combines · Methods and source limits
The pattern, with its units kept intact
The figure shows the reported assignment contrasts within the retained samples: imposed AI Mode minus unchanged Google. People who made no Google searches during the intervention were excluded after assignment; the survey additionally requires completion. Negative values mean less of the named outcome; positive values mean more. The axes change because the questions change.
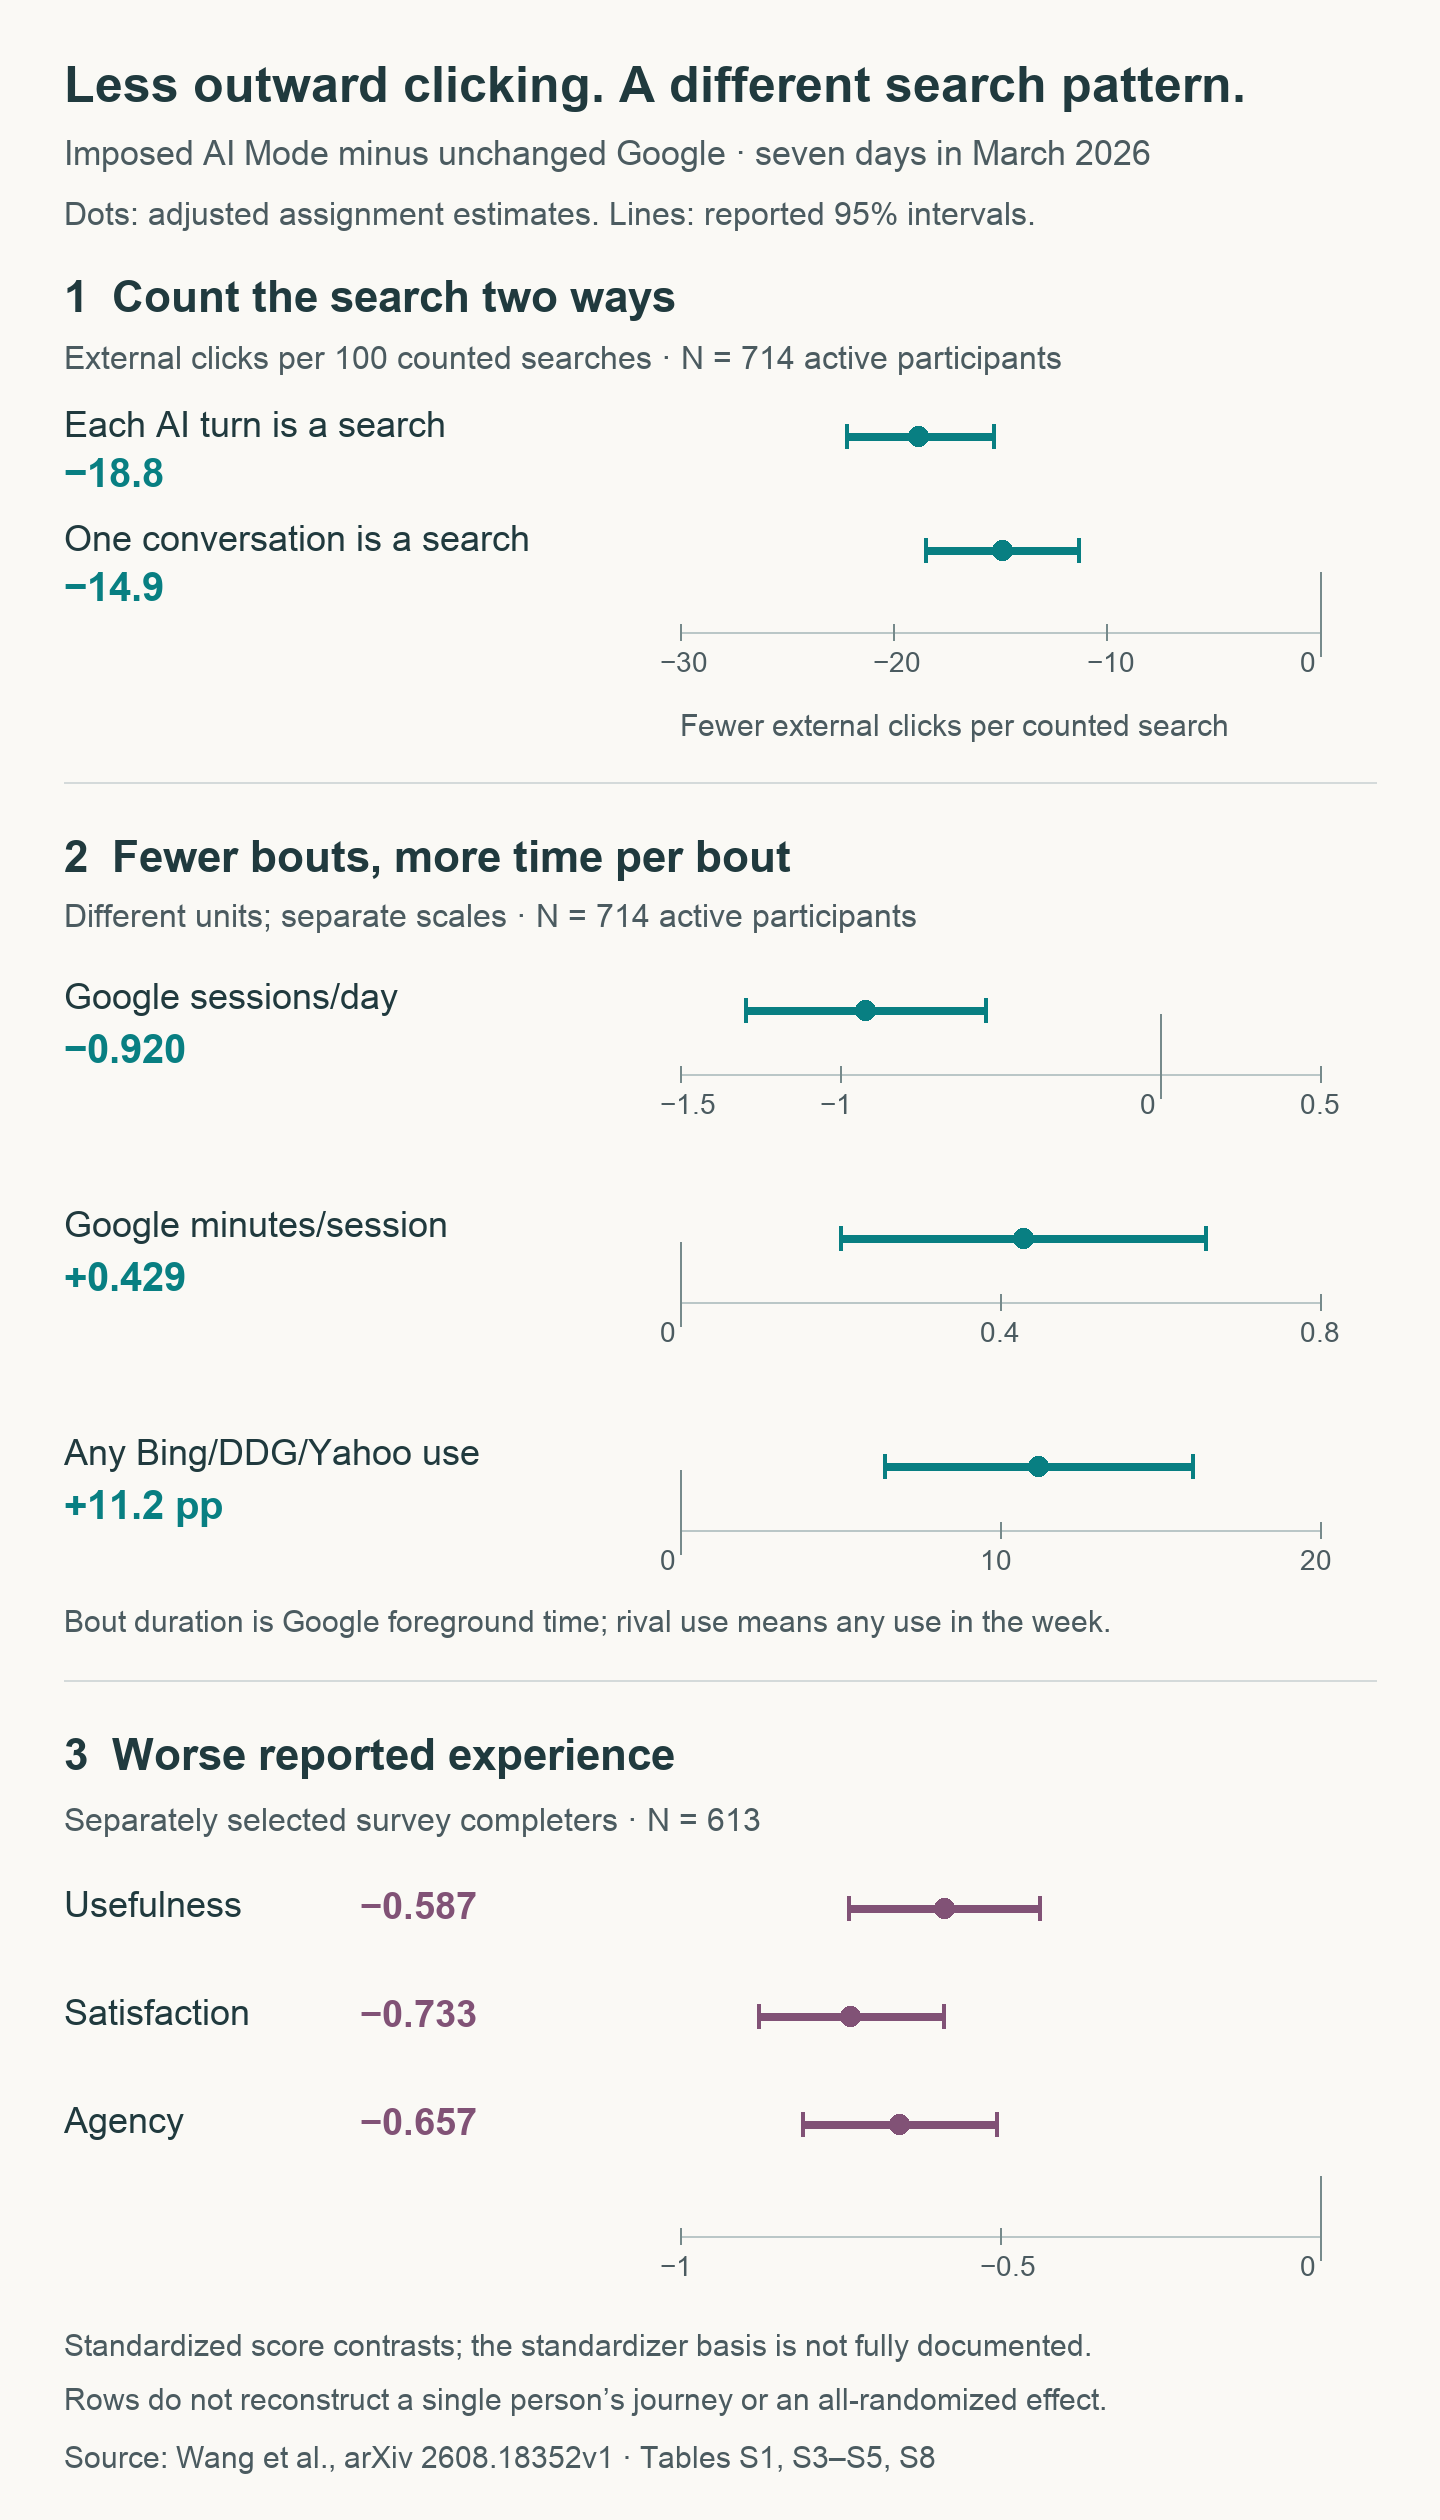
Exact figure values, intervals and source tables
All estimates compare imposed AI Mode with unchanged Google. Behavioral N = 714 is the pairwise active-search sample; survey N = 613 additionally requires completion. Intervals are the source's reported 95% intervals, not simultaneous intervals adjusted for multiple testing.
| Outcome and unit | Estimate | 95% interval | Pairwise N | Source |
|---|---|---|---|---|
| External clicks per 100 turn-counted searches | −18.8 | −22.2 to −15.3 | 714 | S1, p.18 |
| External clicks per 100 conversation-counted searches | −14.9 | −18.5 to −11.3 | 714 | S8, p.36 |
| Google sessions per day | −0.920 | −1.296 to −0.545 | 714 | S1, p.18 |
| Foreground Google minutes per session | +0.429 | +0.201 to +0.657 | 714 | S3, p.19 |
| Any Bing/DuckDuckGo/Yahoo use, percentage points | +11.2 | +6.4 to +16.0 | 714 | S4, p.19 |
| Usefulness, standardized units | −0.587 | −0.736 to −0.438 | 613 | S5, p.19 |
| Satisfaction, standardized units | −0.733 | −0.877 to −0.589 | 613 | S5, p.19 |
| Agency, standardized units | −0.657 | −0.809 to −0.505 | 613 | S5, p.19 |
Download the figure values and conversion factors as CSV. Click ratios are rescaled by 100; the rival-use binary contrast is converted to percentage points. Other rows retain their source units. Standardized survey scores do not have a fully documented standardizer basis in the manuscript.
First ask what the search counter counts
The primary click measure is each participant's external clicks from Google divided by their Google searches. The analysis compares those participant ratios after adjustment. It excludes clicks to google.com and searches in verticals such as Images, News and Shopping. Each AI Mode conversational turn normally counts as another search. Multiple external clicks can follow one search, so the ratio can exceed one. This is not the percentage of queries with a click, a pooled advertising CTR, or the share of people who ever visited a publisher. Definition: S2.4, p.21.
That denominator matters. A continuing AI conversation can add search turns without adding outward clicks. Counting it as several searches makes the click-per-search measure smaller than counting the conversation once, even when the actual outward clicks are unchanged.
The study therefore also counts each conversation once. The reported contrast moves from −0.188 clicks per turn-counted search to −0.149 per conversation-counted search. Expressed on a per-100 scale, those are −18.8 and −14.9 external clicks, respectively. Both reported intervals stay below zero. The direction survives the counting change; the headline magnitude depends on it. Primary estimate: S1, p.18; alternative: S8, p.36.
The per-100 language is a unit conversion of an adjusted participant-ratio contrast. It does not construct 100 observed queries or mean “18.8% fewer clicks.” A relative percentage reduction would require a suitable comparator level. Nor is the 3.9-unit difference between the two point estimates a separately tested difference between correlated estimates.
The original also separately analyzes external clicks per day for readers asking about volume: Table S2, p.18. That daily outcome is different from a seven-day total; neither a period total nor the daily coefficient should be reconstructed by multiplying the ratio or bout contrasts.
Fewer starts can coexist with longer bouts
A search bout here is the paper's Google “session”: a new session begins when the gap between consecutive searches exceeds five minutes. It does not certify that a task began or ended. Under imposed AI Mode, the reported contrast was 0.920 fewer sessions per day, alongside 0.429 more foreground Google minutes per session—about 26 seconds. Frequency and duration: S1 and S3, pp.18–19.
These measures describe different margins. Session frequency asks how often Google searching occurs. Minutes per session asks about time within those bouts, using each participant's foreground-time/session ratio and then comparing participants. Time accumulates only while a Google Search page is in the browser’s foreground; it excludes off-site reading. Operational definition: S2.4, p.24.
An invented example—not participants or findings from this study: three bouts averaging two foreground Google minutes each take six minutes in a day. Two bouts averaging two and a half minutes take five minutes: fewer bouts, longer bouts, less total time. Two bouts averaging four minutes take eight minutes: again fewer, longer bouts, but more total time. The direction of the total depends on how much the longer bouts offset the missing bouts. For one person, bout count multiplied by that person's average bout duration does give the total.
The published contrasts are different objects. −0.920 sessions/day and +0.429 minutes/session are adjusted group differences, not one person's before-and-after counts and durations. Multiplying the differences loses the starting levels. Multiplying group averages loses the connection between each person's frequency and duration: frequent searchers might have longer bouts, or shorter ones. An average of individual totals retains that connection; a product of two averages does not. To establish the empirical total-time direction, we would need a directly analyzed foreground-time/day outcome or the underlying paired quantities and an appropriate analysis. The two reported contrasts alone cannot calculate it—and even Google foreground time would omit off-site reading and remain different from total task time.
The direction of fewer sessions also survives alternative three- and ten-minute boundaries, though its magnitude changes: −1.122 and −0.669 sessions per day, respectively, with reported intervals below zero. The five-minute rule is a measurement choice with a sensitivity check, not a natural task boundary. S9, p.38.
There was also an 11.2-percentage-point higher rate of any Bing, DuckDuckGo or Yahoo use during the intervention week. That outcome is binary ever-use. It neither counts those engines' share of searches nor says that their use was new or permanent. A week containing another engine's use is not a lifetime transfer of allegiance. S4, p.19.
The survey adds something the click counter cannot: participants' assessments of the experience. In the AI Mode-versus-unchanged-Google comparison among 613 survey completers, usefulness was lower by 0.587 standardized units, satisfaction by 0.733 and agency by 0.657; their reported intervals all lie below zero.
Usefulness combines five five-point items, satisfaction four five-point items, and agency one seven-point agreement item: “Over the last 7 days, I had agency over the information-seeking process on Google,” from strongly disagree to strongly agree. That is the participant’s self-assessment of agency, not objective task performance. Agency item: S2.4, p.23; post-survey item 8, p.46.
The manuscript reports standardized effects without fully documenting the population/time basis of that standardization. These numbers cannot be read as raw scale points or percentage declines. Perceived usefulness or accuracy is also not objective task correctness. Scales and results: S2.4, p.23; S5, p.19.
Taken together, the observations make “fewer referrals because search became better” an insufficient account of this experiment. But the rows still do not show that the people who clicked less were the same people who searched longer, used rivals or disliked the experience. They describe adjusted group contrasts, with an additional selection step for the survey. The study does not identify an individual chain of frustration, escape and lost clicks.
Hiding AI asks a different question—and has two answers
The study's third arm attempted to hide AI Overviews, remove AI Mode entry points and redirect Mode to general search. It was compared with the same unchanged Google condition. This tests an AI-hiding intervention; its operation and optional-AI comparator are different from imposed Mode. The hiding treatment deteriorated, so assignment to hiding and actual reduced AI exposure need to be read separately.
Why do two answers matter? The extension hid 51.1% of Overviews overall, with a median participant hiding fraction of 50%; hiding fell from near 90% toward zero after Google's HTML changed. These percentages concern Overviews, not all searches. By contrast, AI Mode routing reached 94.7%. “Assigned to hide” and “experienced substantially less AI” were therefore quite different exposures. Operation: S5.2, pp.30–34.
The reported assignment contrast in external clicks per counted search was +0.027, or +2.7 per 100, with a 95% interval of −0.7 to +6.2 per 100. The pairwise active-search sample was 742. That interval includes zero; it does not establish no effect or equivalence.
The separately reported exposure-adjusted estimate, labeled LATE, was +0.088, or +8.8 per 100, with a 95% interval of +2.3 to +15.3, in a 615-person trigger-exposed pairwise sample. This estimates a relationship with reduced AI exposure using assignment as an instrument.
Its input is each participant’s fraction of Overviews successfully hidden, shown on a 0–1 scale. On that documented fraction scale, +0.088 is the estimated click/search change per one-unit increase in the hiding fraction—an increase of 100 percentage points, not one percentage point. The manuscript supports this unit reading; uninspected data/code leave the implemented regressor’s scaling unverified. This does not show that everyone received complete hiding or establish a full-removal effect. It is not a larger, interchangeable version of the assignment result. Both estimates: S1, p.18. Input definition: S5.2, p.31; model: S4.3, p.28. Input scale: Figure S5, p.32.
The exposure analysis used a continuous hiding fraction, replacing the registered 90% binary compliance definition, and excluded never-triggering users. Its causal interpretation requires assumptions beyond random assignment, including that assignment affects clicking only through reduced Overview exposure. Removing entry points and a breaking interface make that assumption consequential. Continuous-dose instrumental-variable estimation is not automatically an average effect for a simple group of binary compliers. The positive exposure estimate cannot prove that fully removing AI would symmetrically reverse imposed Mode's effect. Analysis and limitations: S4.3 and §4.
“No result click” combines several next actions
The experiment does not locate where its missing clicks went. A separate Pew study helps explain why the label itself is too broad to supply that answer.
Using March 2025 metered browsing and later reconstructed result pages, Pew classified what followed a Google visit with or without an AI summary. Its August 2026 extended abstract reports these rounded shares of all classified visits in each exposure group, not shares only among people who did not click:
- A matched traditional result link: 8% with a summary; 15% without.
- Another Google search: 32% with; 35% without.
- A next destination matched to neither the collected traditional links nor the collected AI sources: 34% with; 33% without.
- Browser exit for at least five seconds: 26% with; 16% without.
- A matched AI-summary source: 1% with a summary. A URL appearing in both places is assigned to the AI summary in the earlier authored report's method.
The rounded categories total 101% with summaries and 99% without; they should not be normalized into invented precision. The unmatched destination could still be a useful page, and only up to three AI-source URLs were collected. Browser exit could accompany task completion or interruption. Continued searching could reflect useful exploration or an unsatisfactory answer. The categories distinguish actions, but none measures task success. Pew extended abstract, Figure 3, p.6, and earlier report.
This is observational evidence from a different year and population. Summary exposure varied with query form: the abstract reports summaries on 60% of question queries and 53% of queries with ten or more words, versus 8% with one or two words. Query mix is a serious alternative to reading the action differences as an AI effect. Regression controls do not turn displayed summaries into randomized exposure. March results were reconstructed afterward, rather than captured as displayed at the time. Methods and query comparisons, pp.1–2 and 5.
Pew's categories show what a no-click label can combine. They are not the missing stages in the March 2026 experiment's participants' journeys, and their traditional-link percentage is not Wang's user-level external-click ratio.
What the finding can travel with
For a referral claim, the useful qualified result is a lower adjusted external-click/search ratio under imposed AI Mode, robust in direction to counting a conversation once, among analyzed active-search volunteers over seven days. For a behavioral claim, retain both fewer bouts and more Google time per bout. For an experience claim, name the separate survey-completer population and standardized perceived outcomes. Those clauses do real work: without them, a measured pattern becomes a claim about universal adoption, total task time or efficiency that the source never observed.
Across the whole three-arm study, 1,444 people enrolled; 1,100 made at least one intervention-period Google search; 956 completed the survey. The displayed AI Mode-versus-unchanged-Google results use two-arm subsets: behavioral N = 714 requires intervention-period Google searching, and survey N = 613 additionally requires completion. These pairwise Ns are not the three-arm totals. Whole-study samples: §2, p.4. Three baseline days preceded seven intervention days. The paper labels assignment estimates “ITT,” but the behavioral sample excludes zero-search participants after assignment, and the survey adds completion selection. Planned exclusion does not preserve randomized comparability after conditioning on a realized outcome. An all-randomized causal effect with explicit zero-search handling remains unestablished here. Sample and selection: §2; S5.3, p.32.
Zero-search rates were 24.0% in No AI, 20.7% in unchanged Google and 26.5% in Mode. The paper's non-significant tests of exclusion/completion patterns do not prove selection harmless. Registration planned an all-randomized behavioral sensitivity; the complete manuscript reports no corresponding result and no rule for including zero-search participants. The survey-completer sensitivity is a different restriction.
Main text/registration describe assignment after baseline, whereas supplement S4.1 says at installation; code execution was not inspected to resolve that timing. Registration and S4–S5.
The estimates adjust participant outcomes for baseline and recruitment channel and use reported robust uncertainty: HC2 for assignment OLS and HC1 for exposure two-stage least squares. Missing baseline covariates receive overall baseline means. Selected behavioral counts/rates are truncated at baseline 99th percentiles, while individual search-focus duration is capped at 24.4 minutes; these are not raw pooled totals.
The figure retains reported 95% intervals, which are distinct from the manuscript's multiple-testing-adjusted p-values.
The aggregate data/code deposit is not used here, so these are source-reported estimates with arithmetic unit conversions, not independently reproduced regressions. The source states that raw browsing traces are withheld for privacy. Objective task correctness, off-site reading time, campaign return, voluntary adoption and permanent switching remain outside the measured answers.
Source editions, limits and declarations
Experimental source. Wang, Gleason, Bart, Wilson and Metaxa, AI in Search Reduces Publisher Referrals Without Improving User Experience: Experimental Evidence, arXiv 2608.18352v1, August 18, 2026, main text and complete supplement. The aggregated reproduction deposit is not used here. Comparisons with the registration rely on its public registration page, not on data/code files, and that page is not established as the version available at the evidence boundary. Continuous compliance replaced registered binary compliance; a registered baseline-search moderator becomes baseline sessions, and broad registered winsorization language becomes specified metrics/cap. These differences do not create a new numerical result or a blanket invalidity finding. Some main-text p-values differ from labeled table columns; the results here follow the tables without inventing a reconciliation.
Pew source. Chapekis, Lieb, Shah and Smith, arXiv 2608.04831v1, August 5, 2026; July 22, 2025 authored report and metered-data methodology. These use the same panel, not independent replications. The broader March sample is 900 panel adults, with 91,121 visits and 68,879 distinct queries. Regression tables name 647 panelists; that accounting is not explained and should not replace the broader panel description. The extension gives April 10–11 reconstruction, the earlier report April 7–17; the edition difference remains unresolved. Tracking consent/device coverage, reconstruction and query selection limit interpretation; report weighting does not establish undocumented weighting in the extended regression.
Declarations. The experimental manuscript authors declare no competing interests. They report partial National Science Foundation support under award IIS-2442711, and separate support for J.G. through the Platforms for Exchange and Allocation of Resources (PEAR) program, an NSF Research Traineeship. These are their declarations, not independent verification of interests or funding. Participants were compensated. Manuscript declarations, p.13.
Time boundary. The evidence boundary is October 1, 2026, 08:01:09 UTC. The cited source versions are not established as the editions available at that boundary. Changed code/assignment information, an all-randomized selection sensitivity, corrected source definitions, or longer voluntary-use/task-success evidence could change the interpretation. Current interface inventory alone cannot rewrite what this historical week measured.
The defensible account has more than one sentence: in the retained active-search comparison, imposed AI Mode versus unchanged Google showed lower adjusted external clicking per counted search under both counting rules, fewer Google bouts per day, more foreground Google time per bout and higher rival ever-use; a separately selected survey reported worse experience. That is a measured pattern worth explaining. It still leaves the most tempting ending—what each person achieved with the missing click—unwritten.